Objectives
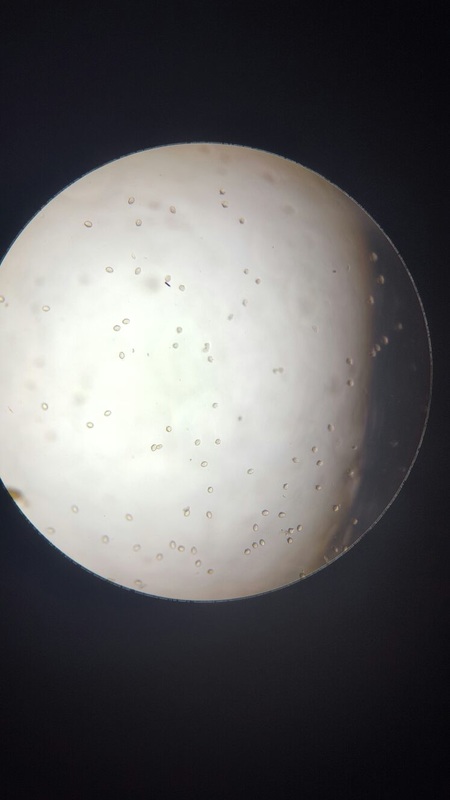
- Observe the growth of pollen grains.
- Develop the skills of planning investigations and carrying out dilutions.
- Carrying out research and cite sources of information to support planning and conclusions.
Safety
- Take care with glass slides and mounted needles to prevent breakages and stick injuries.
- Take care if you are allergic to pollen.
- Wash hands after handling flowers or plant stems.
Equipment
- Sucrose solution 2 moldm^-3
- mineral salt culture medium
- microscope
- stage micrometer
- plants in flower
- five petri dishes
- filter paper
- marker pen distilled water
- measuring cylinders
- stop clock
- balance
- scissors
- forceps
- mounted needle
- dropping pipette
- very clean cavity slides
Procedure
We got into a group of four people aand each carried out the experiment at different concentrations of sucrose and mineral concentrations.
We got into a group of four people aand each carried out the experiment at different concentrations of sucrose and mineral concentrations.
- Carry out research to find out what concentrations of sucrose might be a suitable range to test in this experiment. http://www.nuffieldfoundation.org/practical-biology/observing-growth-pollen-tubes http://www.sciencedirect.com/science/article/pii/S0012160606014035http://www.saps.org.uk/secondary/teaching-resources/222-student-sheet-4-pollen-tube-growth
- We will use concentrations of: 0.0 , 0.2, 0.4, 0.8, 1.6 Sucrose solution mol dm^-3 at equal concentrations of mineral salt culture medium when added to the slides.
- Collect one Petri dish per planned sucrose concentration and label the dishes. Place a filter paper in each dish, moisten the paper with water and replace the lids. The Petri dish will act as a humid chamber in which the pollen slides will be placed to prevent them from drying out. The slides will be used without a coverslip to prevent anoxic conditions developing that might prevent pollen tube growth.
- Collect one microscope slide per sucrose concentration and label the slides. Be careful not to touch the centre of the slides as they must be absolutely clean. Place a few drops of the sucrose plus mineral salt medium in the central cavity of each slide. Label the slides with the sucrose concentrations you are investigating.
- Collect a flower that has several mature anthers and is shedding pollen, as riper pollen has a better chance of successful germination. Gently rub the point of a mounted needle over the anthers so that pollen falls on to the medium on each slide. Dislodge any pollen stuck to the needle by tapping the needle against a pencil or forceps. Do not add a coverslip. Repeat for each sucrose concentration.
- Note the time at which the pollen was added to the medium and place the slides in the Petri dishes. Remove only when observing with the microscope.
- We returned to take pictures of our results every hour so that we could meausre the percentage of pollen that had produced pollen tube.
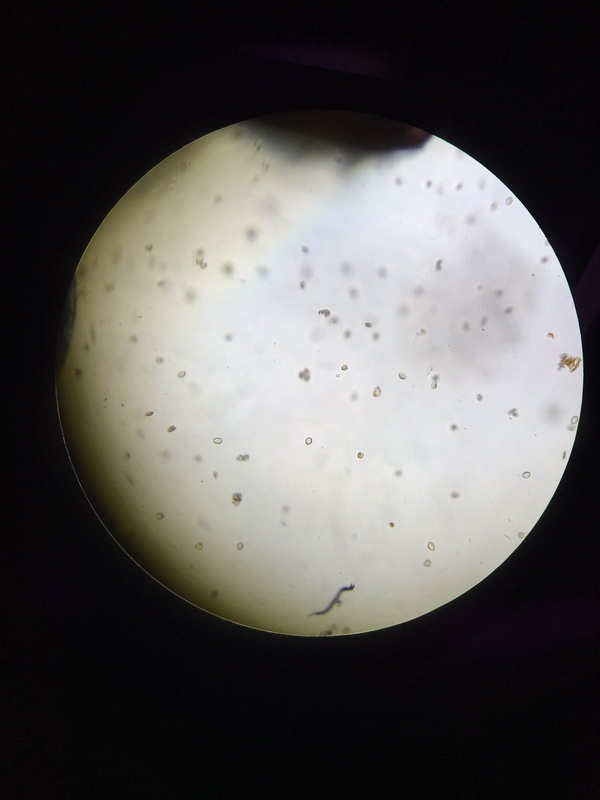
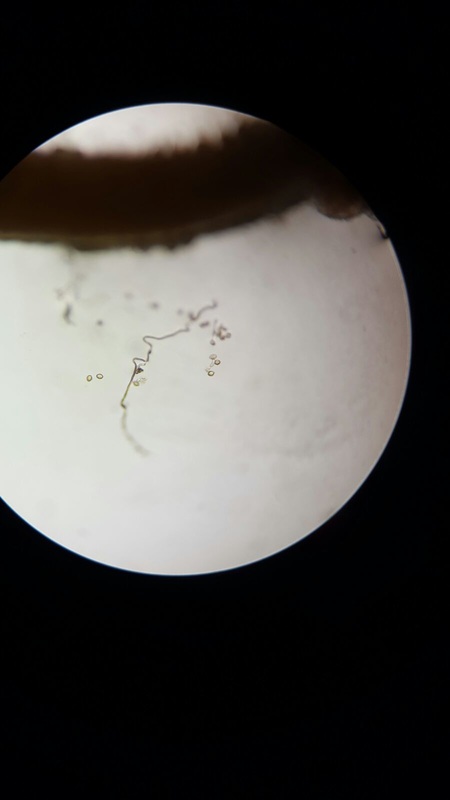
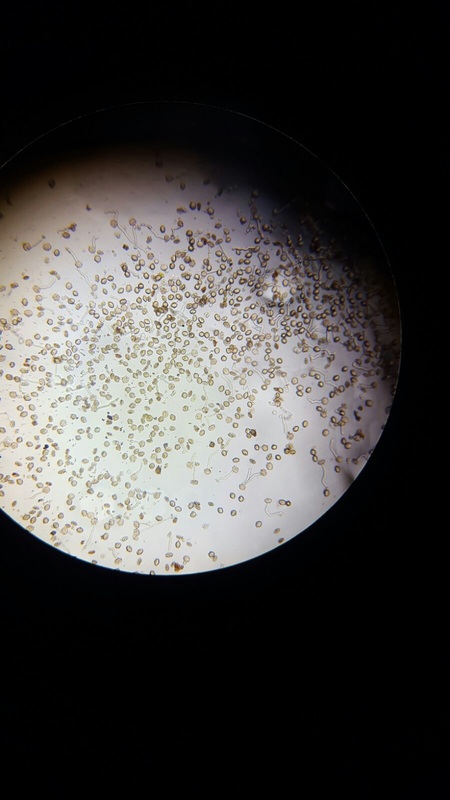
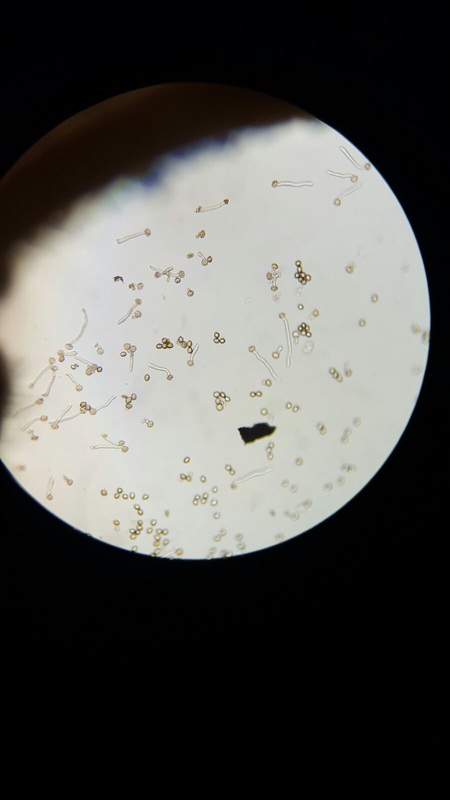
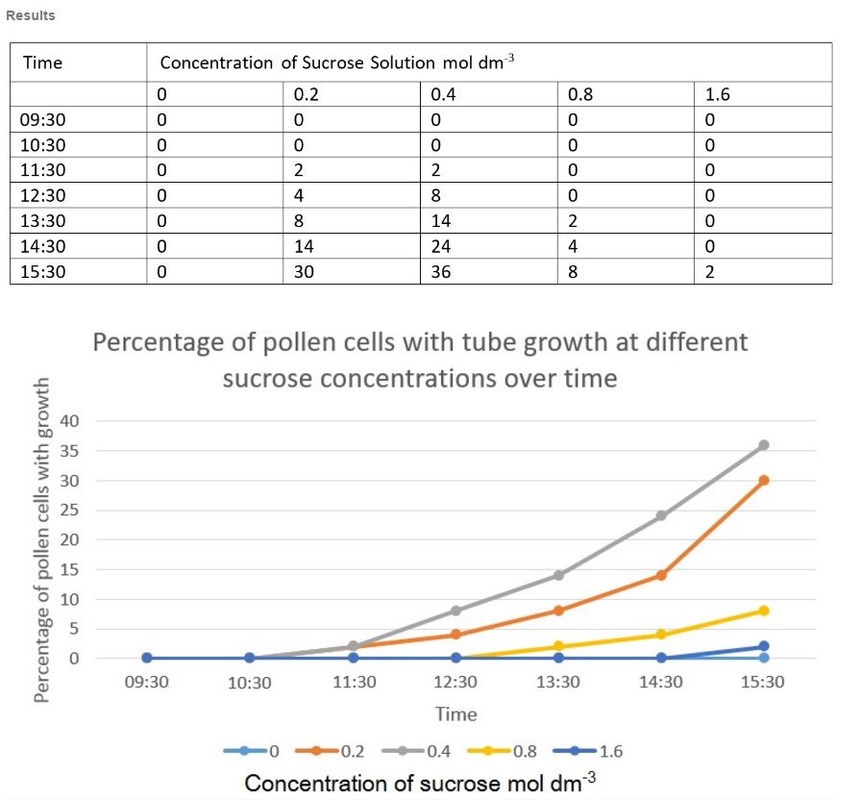
Results:
Analysis:
The best concentration for pollen tube growth is 0.4 mol dm^3 as this produces the highest percentage of pollen cells with growth through the whole experiment. The worst concentration was 0 and 1.6 moldm^3 as this produced the lowest number of pollen tubes with growth. Interestingly 0.8 moldm^3 produced a lower percentage of pollen tubes with growth than 0.2 moldm^3. The optimum concentration is probably around 0.3 to 0.6. The stunted growth of the polen tubes at the higher concentrations is due to the solutions containing a lower water potential than the cells that have a higher water potential. This would cause water to move out of the cells and into the solution. This may cause the pollen cells to become plasmolyed and thus they may be unable to produce pollen tubes. At 0 moldm^3 the pollen tube may have a lower water potential to the outside of the cell and thus water will move into the cell. This could have caused lysis of the pollen cell and hence lead to the pollen tubes being unable to produce pollen tubes. Furthermore, some of the sucrose and mineral solutions may be needed by the pollen cell to be used in respiration to produce the pollen tube and thus with no sucrose in the solution the pollen tube cannot produce a tube.
Evaluation
We tried to keep our experiement under the same conditions by ensurong we used petri dishes so that the solutions didnt evaporate away. We also kept the volumes of each solution we put on the slides the same despite the different concentrations. However there was several issues with how we carried out our results. As we only had one microscope we couldnt keep the same place where we viewed each slide to take pictures. This meant that it is hard to compare the percentage of pollen tubes over the time period as it was focusing on different areas of the slide.
We also didnt repeat our results which may have highlighted any anomalies in our data . It was also hard to get enoguh pollen from the anthers and thus some of the slides had more pollen distribution than others which may have affected our results. Finally, as we only did one type of plant we havent compared our results with the other group who used a different plant which would have been intersitng.
 RSS Feed
